

HPE ProLiant Benchmark Newsletter: технические характеристики и документация
|
|
HPE Server Performance Benchmarks Newsletter |
|
September 2019 |
|
HPE Gen10 servers SHATTER with 37 world records on AMD EPYC™ leaderboard!1 |
|
UPDATE: 191 world records |
|
HPE competitive benchmarking results give an important edge to successful sales techniques. HPE servers sustain world record status in performance and price-performance. The HPE portfolio of ProLiant Gen10 servers, HPE Integrity servers, and HPE Synergy Gen10 Compute Modules carry on, achieving worldwide #1 records across the performance landscape. See Marketing Documents Library webpage for Benchmark and Performance Guides. | |||||||||||||||||||||||||||||||||||||||||||||||||||||||
|
The HPE ProLiant DL385 Gen10 and DL325 Gen10 recently took a total of 72 performance leadership results and 16 First records on the SPEC CPU 2017 benchmark. HPE Gen10 servers now hold 191 world records and 47 First records! | |||||||||||||||||||||||||||||||||||||||||||||||||||||||||
|
11 more records than Lenovo and more than Alibaba, Giga-Byte, and Supermicro COMBINED! | |||||||||||||||||||||||||||||||||||||||||||||||||||||||||
|
|
HPE ProLiant DL325 Gen10 | ||||||||||||||||||||||||||||||||||||||||||||||||||||||||
|
HPE Performance Leadership!
192 WORLD RECORDS
HPE Performance Trailblazer!
47 FIRSTS |
| ||||||||||||||||||||||||||||||||||||||||||||||||||||||||
|
AMD EPYC Leaderboard records and competitive claims for listed benchmark results are as-of August 7, 2019, unless otherwise noted.
See next page for more wins and performance details. | |||||||||||||||||||||||||||||||||||||||||||||||||||||||||

|
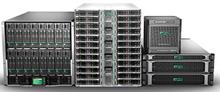
HPE Gen 10 servers continue to hold numerous leadership results! |
|
The following lists current world records and industry-first successes with the latest and prior generation Intel® Xeon® and AMD EPYC processors. Find detailed slides on these records in the Performance wins deck that is viewable internally by HPE and Partners. For a complete list of performance briefs across all processor generations, see the Marketing Documents Library |
|
ProLiant DL325 |
ProLiant DL385 |
|
|
|
|
Performance Score Card SPECpower_ssj2008
TPCx-HS On the TPCx-HS @ 10TB scale factor:
On the TPCx-HS @ 30TB scale factor:
TPC-H @ 1000GB Non-clustered:
4-node cluster:
8-node cluster:
4-node and 8-node clusters (tied):
VMmark 3.1
SPECjbb2015
SPEC CPU 2017*
|
Performance Score Card SPECpower_ssj2008
SPECjbb2015
SPECvirt_sc2013
TPCx-V
VMmark 3.1
SAP Sales and Distribution standard application benchmark, two-tier
SPEC CPU 2017*
*SPEC CPU 2017 as-of-date is September 18, 2019
|
||||||||||||
|
AWARDS and RECOGNITION |
|
|
ProLiant DL325 Gen10 An EPYC-powered stunner |
|
Product of the Year HPE ProLiant DL325 Gen10 Favorite pick for All-Purpose Server |
|
ProLiant DL385 Gen10 Big power, bigger value |


|
ProLiant DL380 |
ProLiant DL560 |
|
|
|
|
Performance Score Card VMmark
TPC-H (non-clustered)
|
Performance Score Card SAP Business Warehouse, Edition for SAP HANA Standard Application Benchmark Version 3
- #1 4P on Phase 1
- #1 4P on Phase 1 - #1 4P on Phase 3 SPECjbb2015
SPECpower_ssj2008
|
|
ProLiant ML350 |
ProLiant DL580 |
|
|
|
|
Performance Score Card SPECpower_ssj2008
|
Performance Score Card SPECpower_ssj2008
|


|
AWARDS and RECOGNITION |
|
|
HPE ProLiant DL560 Gen10 High density Xeon Scalable power station at a tempting price |
|
HPE ProLiant ML350 Gen10 A perfect balance of power and value |
|
Synergy 480 |
Synergy 660 | |
|
|
|
|
|
Performance Score Card SPECpower_ssj2008
VMmark
- #1, first, and only 6-node/2P result - #1 6-node composable infrastructure result
- #1 and first 8-node/2P result - #1 8-node composable infrastructure result
- #1 and first 16-node result - #1 and first 16-node/2P result - #1 and first 16-node composable infrastructure result
- #1 overall result - #1 and first 24-node result - #1 and first 24-node/2P result - #1 and first 24-node composable infrastructure result |
Performance Score Card SPECpower_ssj2008
|
|


|
Superdome Flex |
|
|
Performance Score Card SPEC CPU2017 benchmark
SPEC CPU2006 benchmark
SPEC OMP2012 benchmark
SAP Business Warehouse, Edition for SAP HANA Standard Application Benchmark Version 3
- #1 8P on Phase 1 - #1 8P on Phase 3 |
|
|

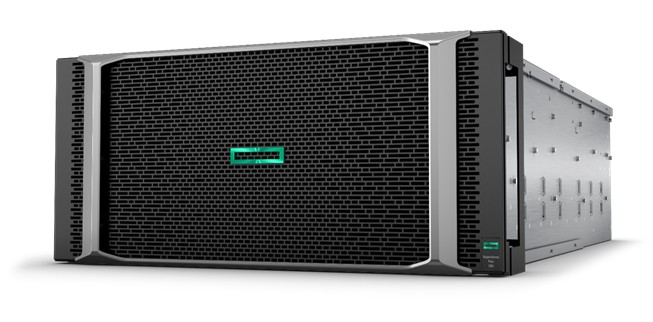
|
Fair use and compliance information and system configurations |
|
All benchmark data is publicly available on the websites listed below. All performance briefs listed are publicly available on or on the server Documents webpages and are customer viewable. See benchmark details below. |
|
HPE Configurations SAP® Business Warehouse (BW), edition for SAP HANA® standard application benchmark version 3 ProLiant DL385 Gen10: Claim based on overall #1 2P performance on the two-tier SAP Sales and Distribution standard application benchmark with AMD EPYC 7702 2.20 GHz processors; 2 processors/128 cores/256 threads; Microsoft Windows Server 2019; Microsoft SQL Server 2017; SAP enhancement package 5 for SAP ERP 6.0; 1 TB main memory. Certification #2019044. Number of benchmark users: 45,600; SAPS: 249,550; Average dialog response time: 0.96 seconds. Tested by HPE on August 7, 2019. ProLiant DL560 Gen10: Claim based on best-published 4P SAP HANA V3 Standard Application Benchmark @ 5.2 billion (5.2B) initial records result published as of April 2, 2019. 4 Intel Xeon Platinum 8280L processors (112 cores/224 threads) with 3072-DDR4 GB total memory, running SUSE Linux Enterprise Server (SLES) 12 SP4, using HANA 2.0 Rev. 35 and NetWeaver® 7.50. Certification# 2019019. SAP HANA V3 Standard Application Benchmark score: Runtime of Data Load/Trans (14,030 secs), Query Executions per Hour (5086 secs), Total Runtime of Complex Query (97 secs) @ 5.2B. Tested by HPE on March 22, 2019. Claim based on best-published 4P SAP HANA V3 Standard Application Benchmark @ 6.5 billion (6.5B) initial records result published as of April 2, 2019. 4 Intel Xeon Platinum 8280L processors (112 cores/224 threads) with 3072-DDR4 GB total memory, running SLES12 SP4, using HANA 2.0 Rev. 35 and NetWeaver 7.50. Certification# 2019022. SAP HANA V3 Standard Application Benchmark score: Runtime of Data Load/Trans (18821 secs), Query Executions per Hour (secs), Total Runtime of Complex Query (107 secs) @ 6.5B. Tested by HPE on March 22, 2019. Claim based on best published 4P at 6.5 billion initial records with HPE Persistent Memory result published as of April 2, 2019. 4 Intel Xeon Platinum 8280L 2.70 GHz processors with (112 cores/224 threads) with 32 GB HPE DDR4 Smart Memory and HPE Persistent Memory total running SLES 12 SP4 using SAP HANA 2.0 Rev. 35 and NetWeaver 7.50 SP04. Certification #2019020. SAP HANA V3 Standard Application Benchmark score: Runtime of Data Load/Trans (21,533 secs), Query Executions per Hour (3,825 secs), Total Runtime of Complex Query (135 secs) @ 6.5B. Superdome Flex Claim based on 11.7 billion initial records: 8 Intel Xeon Platinum 8280L 2.70 GHz processors with (224 cores / 448 threads) with 12 TB memory; SUSE Linux Enterprise Server 12 SP 4, SAP HANA 2.0, NetWeaver 7.50. Source: Certification number 2019021: Scores: Total Runtime of Data Load for the last data set/Transformation 20,947 seconds; Query Executions per Hour 4,722; Runtime of Complex Query (150 secs) @ 11.7B. Results achieved with Intel security mitigations are not comparable to results achieved without the mitigations. TPC-H ProLiant DL325 Gen10: Non-clustered result: Claim based on having the #1 price-perform and #1 and first 1P performance for a non-clustered system on the TPC-H @ 1000GB scale factor. Configuration: 1 HPE ProLiant DL325 Gen10 server used 1 AMD EPYC 7502P 2.5 GHz processor; 1 socket/32 cores/64 threads; Red Hat® Enterprise Linux 8; Microsoft SQL Server 2017 Enterprise Edition. TPC-H results show the HPE ProLiant DL325 Gen10 with a result of 743,750.60 QphH @ 1000GB and $0.34 USD/QphH @ 1000GB with a system availability of August 26, 2019; see tpc.org/3342. 4-node and 8-node results: Claim based on having the #1 1P performance for a 4-node cluster; #1 overall performance for clustered systems; #1 1P performance for an 8-node system; and #1 overall price-performance for clustered systems (tie for 4-node and 8-node clusters) on the TPC-H @ 1000GB scale factor. ProLiant DL380 Gen10: Claim based on best-published 2P TPC-H benchmark @ 3,000GB non-cluster results published at tpc.org as of April 2, 2019. New configuration: 1-Node, 2 Intel Xeon 8280 processors (2 processors, 56 cores, 112 threads) with 1,536 GB total memory on SUSE Linux Enterprise Server 15 using Microsoft SQL Server 2017 Enterprise Edition. Source: tpc.org/3336. Score: 1,244,450.6 QphH @ 3000GB, $0.38/QphH @ 3000GB available April 2, 2019. Tested by HPE on April 1, 2019. Claim based on best published TPC Express Benchmark Big Bench (TPCx-BB) @ 10000 GB result published at www.tpc.org as of April 2, 2019. New configuration: 18 HPE ProLiant DL380 Gen10 servers with 2 Intel Xeon Gold 6254 processors and 3 ProLiant DL360 Gen10 servers with 2 Intel Xeon Gold 5218 processor for worker nodes on Red Hat Enterprise Linux Server 7.5 on Cloudera for Apache Hadoop (CDH) 5.16.1. Source: tpc.org/3510. Score: 1,759.64 BBQpm @10000 @ $521.34 USD/BBQpm @ 10000 GB available April 2, 2019. Tested by HPE on 1 April, 2019 1000GB scale factor Claim based on the #1 world record with a non-clustered result of 1,009,065 QphH @ 1000GB and $0.47 USD/QphH @ 1000GB with system availability of May 21, 2018; see tpc.org/3331. 3000GB scale factor Claim based on the #1 record with a non-clustered result of 1,244,451 QphH @ 3000GB and $0.38 USD/QphH @ 3000GB with system availability of April 2, 2019; see tpc.org/3333. |
|
TPC-HS ProLiant DL325 Gen10: Claim based on having the #1 overall performance and price-performance @ 10TB scale factor and the #1 overall performance and price-performance @ 30TB scale factor. Configurations: 17 HPE ProLiant DL325 Gen10 servers with AMD EPYC 7502P 2.0 GHz processors; 17 sockets/544 cores/1088 threads; Red Hat Linux Enterprise Server 7.6; Hortonworks Data Platform 3.1; 256 GB memory. Results: 23.66 HSph@10TB and $25,057.91 $/HSph@10TB; system availability August 26, 2019; see tpc.org5532; 17 HPE ProLiant DL325 Gen10 with AMD EPYC 7502P 2.0 GHz processors; 17 sockets/544 cores/1088 threads; Red Hat Linux Enterprise Server 7.6; Hortonworks Data Platform 3.1; 256 GB memory. Results: 25.67 HSph@30TB and $27,649.40 $/HSph@30TB; system availability August 26, 2019; see tpc.org/5533. TPCx-V ProLiant DL385 Gen10: Claim based on #1 overall performance and price-performance TPCx-V benchmark published at tpc.org as of August 7, 2019. Configured as AMD EPYC 7702 2.0 GHz processors: 2 processors/ 128 cores/ 256 threads; Red Hat Enterprise Linux Server 7.6; VMware® vSphere® 6.7; system availability October 15, 2019. Scores: 2,280 tpsV and $36.26 USD per tpsV. See tpc.org/5302 VMmark® 3.1 ProLiant DL325 Gen10: Claim based on having the #1 1P 4-node result and the first P 4-node result with AMD EPYC 7702 processors with a score of 12.23 @ 13 tiles. Results as of August 7, 2019. ProLiant DL385 Gen10: Claim based on being the #1 2P 2-node result with AMD EPYC 7702 processors with a score of 2.78 @ 14 tiles. Results as of August 7, 2019. VMmark 3.0 Synergy 480 Gen10: Claim based on being the first and #1 composable infrastructure result with Intel Xeon Platinum 8180 processors and with a score of 7.93@ 8 tiles. Claim based on being the first published results and the first results with Intel Xeon Platinum 8180 processors with a score of 5.88 @ 6 tiles. Claim based on having the #1, first, and only 6-node/2P results; and #1 6-node composable infrastructure result with Intel Xeon Gold 6252 processors and with a score of Claim based on having the #1 and first 8-node/2P result and #1 8-node composable infrastructure result with Intel Xeon Gold 6140 processors and with a score of Claim based on having the #1 and first 16-node result; the #1 and first 16-node/2P result, and #1 and first 16-node composable infrastructure result with Intel Xeon Gold 6140 processors and with a score of 30.13 @ 32 tiles. Claim based on having the #1 overall result; the 1 and first 24-node result; #1 and first 24-node/2P result, and #1 and first 24-node composable infrastructure result with Intel Xeon Gold 6140 processors and with a score of 46.10 @ 48 tiles. ProLiant DL580 Gen10: Claim based on having the first 2-node, 4P result on the VMmark 3.0 benchmark; score 14.82 @ 15 tiles. VMmark 2.5.2 ProLiant DL380 Gen10: Claim based on the #1 2P, two-node score on the VMmark 2.5.2 benchmark with a score of 39.75 @ 34 tiles which is also the first result with Intel Xeon Platinum 8180 processors on the VMmark 2.5.2 benchmark. SPEC OMP2012 For SPECompG_peak2012, various thread counts were used for the different socket configurations with a range of 144 to 288 threads for the 8S result, a range of 256 to 576 threads for the 16S result, and a range of 512 to 576 threads for the 32S results. |
| |||||||||||||||